Blar Search 0.1 Benchmark
20-03-2024

In the previous article, we did a general overview of different search algorithms, their pros and cons, and how having greater context helped make a better search algorithm. At the end of the article, we discussed how Blar uses graphs to enrich the nodes with context from their neighbourhood and how this helped us improve search accuracy. The problem is that we didn’t mention any metrics or benchmarks to sustain our claims ¹. So, to redeem ourselves, we created this new post explaining how we created a benchmark to test our hypothesis and prove our claims.²
Step 1: Find a suitable Dataset
Our first mission was to find a dataset that matched specific characteristics. This dataset had to be a question-answering (QA) dataset because it is the easiest way to measure retrieval accuracy. Second, the question had to come from a source we could transform into a graph (we’ll write an article shortly about it). If the source came from a single paragraph with no context or metadata, it would be impossible to link the nodes together. If this happens, our method would result in an inefficient vector database. Finally, this dataset had to include a way of telling the relevant passages to answer the question.
With these criteria in mind, we began our search for the perfect dataset. Luckily, we quickly stumbled upon an academic paper from 2022 named Modern Question Answering Datasets and Benchmarks: A Survey. Inside this paper, we found many different datasets, some long, some short, some about maths, and some about medicine. But one of the datasets stood apart, QASPER. This dataset had everything we’d been looking for.
"QASPER is an information-seeking question-answering (QA) dataset over academic research papers".
Qasper is ideal because it is a QA dataset, we could convert the academic research papers into a graph, and it has the evidence required to answer a given question. It was perfect.
Step 2: Prepare the benchmark
In QASPER, each academic paper is separated into sections and paragraphs. That was very useful as we didn’t need to parse the PDF to build our graph based on this. We achieved this by having the title as the central node, each section as children to the title node, and the paragraphs as children of their respective sections. We also further split the paragraphs into sentences. Later, we embedded the paragraphs, sentences, and sections using UAE large v1.

Representation of a document as a graph, Note: The sentences are not included in this visualization, just the paragraphs
As we only cared about data retrieval and not question answering, instead of prompting both the question and the evidence to an LLM, we just focused on the evidence section. We marked the paragraph as relevant results if it was present in the evidence and irrelevant otherwise. This way, we created a binary array of all the paragraphs marking with the number 1 if it’s relevant and 0 if it’s irrelevant. One thing to note is that we created this array using the paragraphs and not the sentences, and we considered all evidence as equally relevant or irrelevant.

The red circle around the nodes denote relevant paragraphs for a given question
Step 3: Run the results
So the moment we’ve all been waiting for: the result. As evaluation metrics, we used mean average precision at 10 and 5 (MAP@5/ MAP@10), normalized discounted cumulative gain at 10 (NDCG@10), and mean recall at 10. We used the test split of QASPER and removed questions about figures and tables (we leave this for the next time ;) ), ending up with 1310 questions across 416 unique papers.
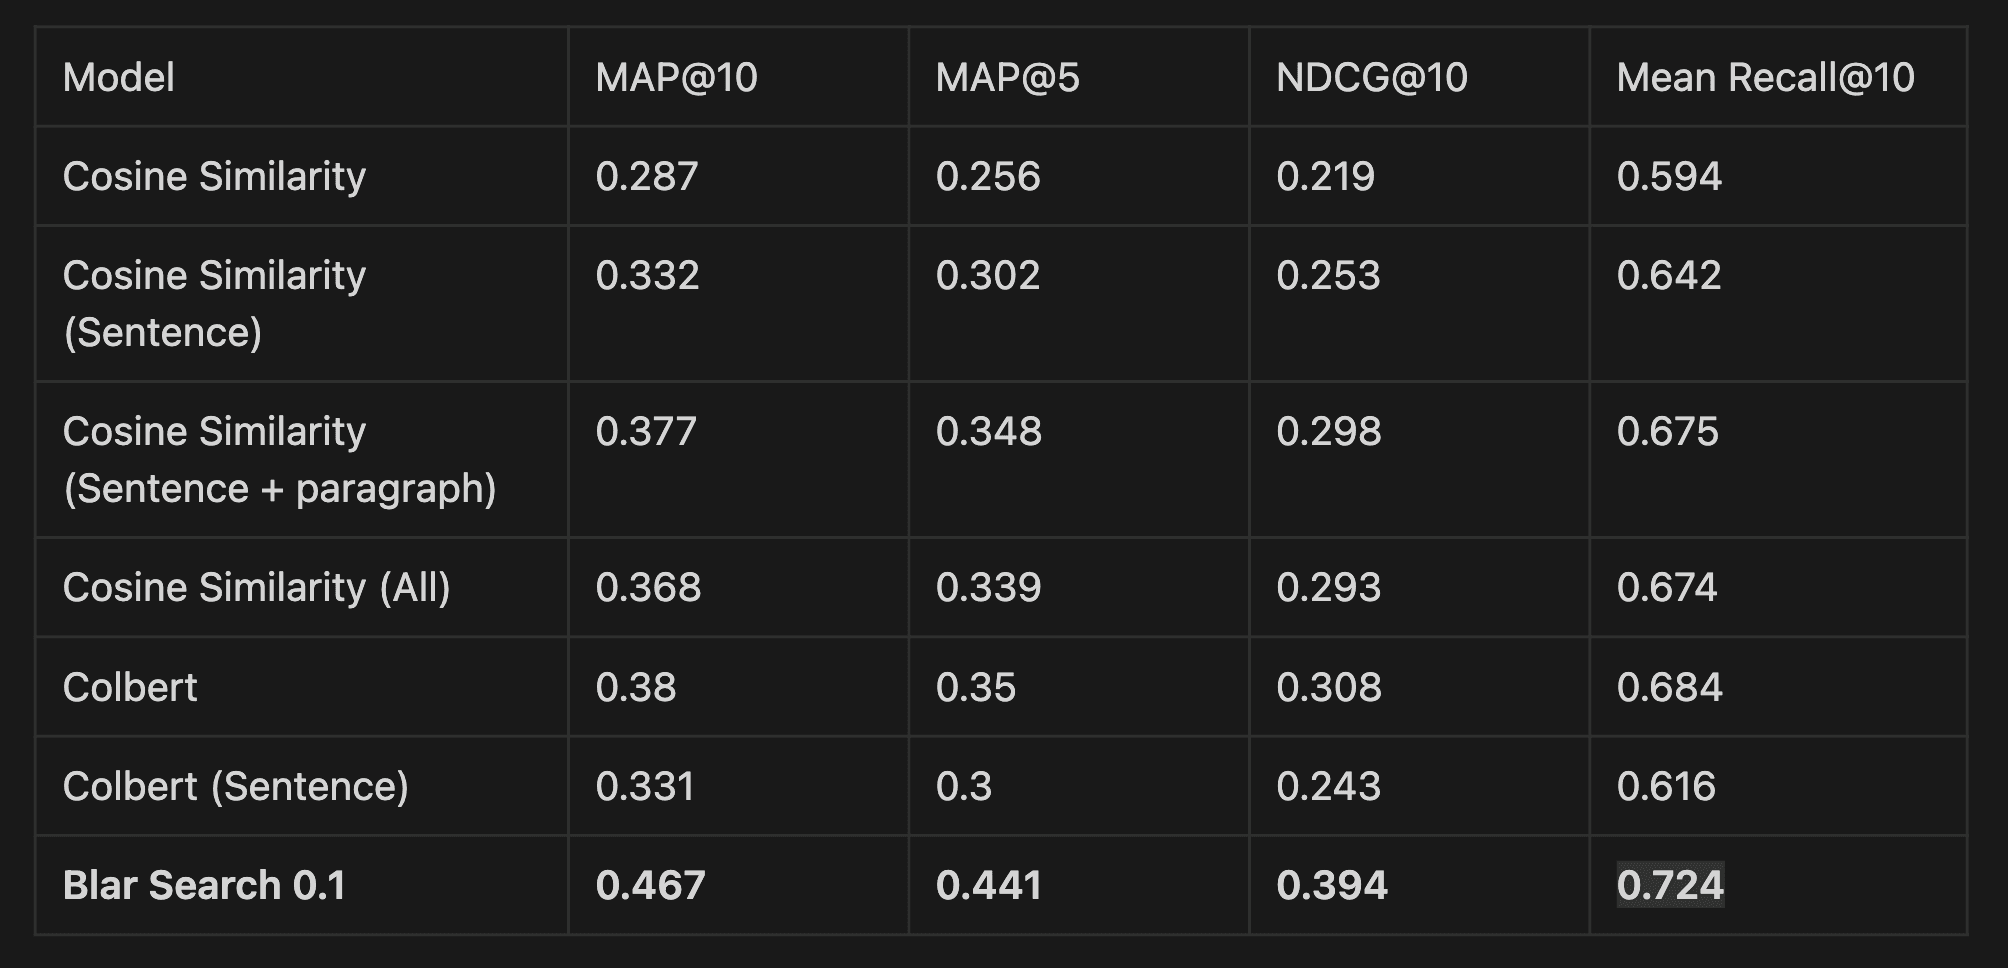
Our model uses both the embeddings from the paragraph and the sentences to make predictions. To make it a fair comparison, we tested how different methods behaved on the paragraph and on the sentence level. In the “sentence + paragraph” case, we used a weighted sum (previously learned by our model). Finally, in the “All” scenario, we removed the GNN layers from our model and calculated the behaviour. The latter was the same as doing a weighted sum across the different components (sentence + paragraph + question tokens).
The results clearly show that our method outperforms simple cosine similarity comparison. It’s also better than more advanced methods like ColBERT, proving that using a combination of graphs and GNN can enrich the embeddings with neighbouring context, and this enrichment helps in identifying relevant passages in a QA environment.
Step 4 (Optional): Visual representation
We created a few visual representations to compare our model performance against different methods.
The following images are a comparison of the scores each node gets using first cosine similarity and then our method, both results ran on the same question. As you can see, cosine similarity chose the title as the most relevant node to answer the question.
Cosine Similarity
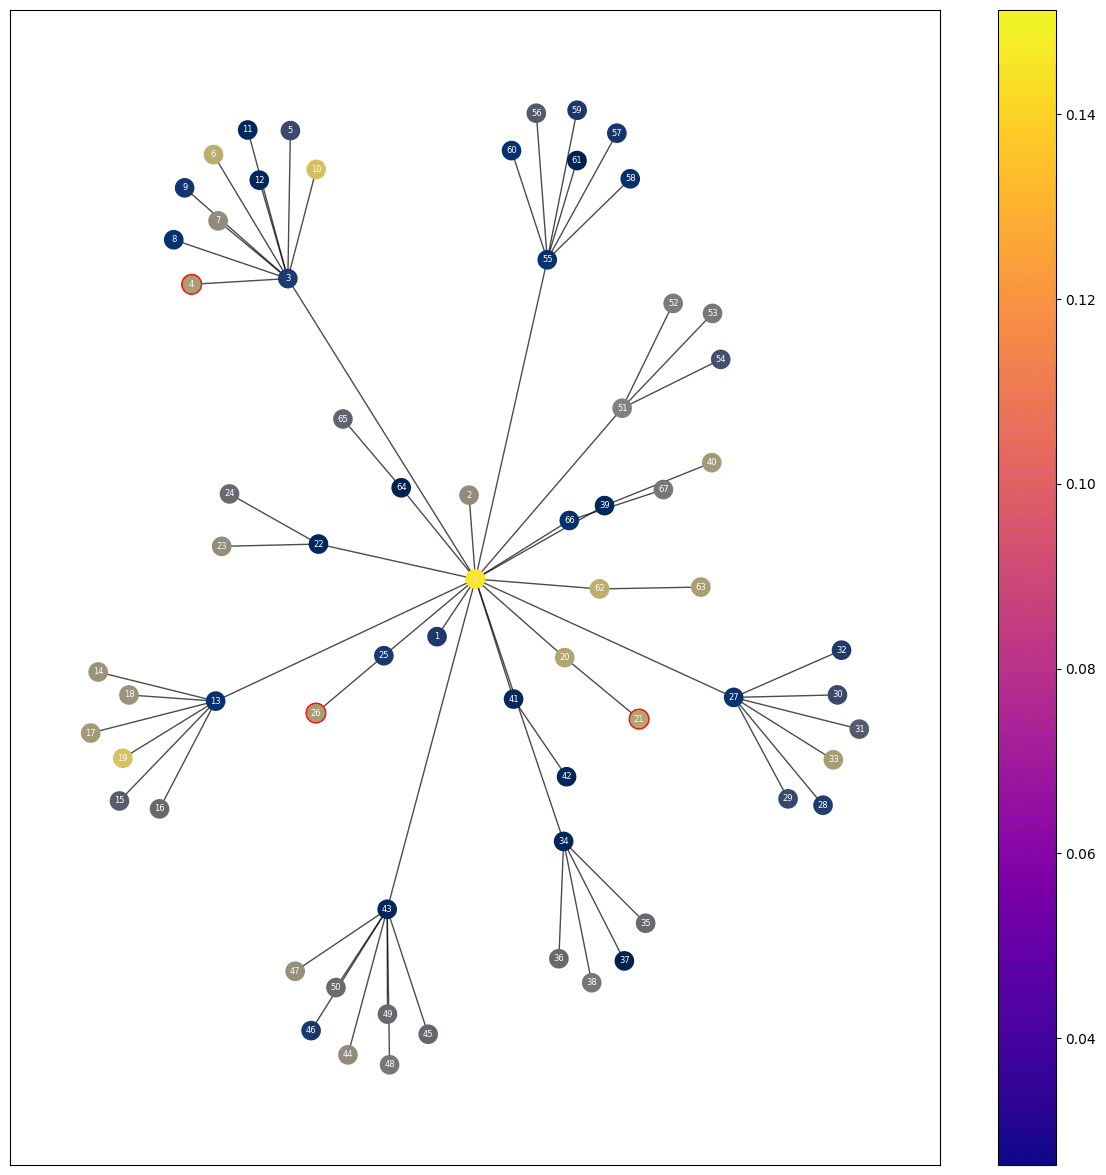
Results of comparing simple cosine similarity between question and passage, the red circles represent the ground truth, the color represents the relative score, the brighter the higher the score.
Our method
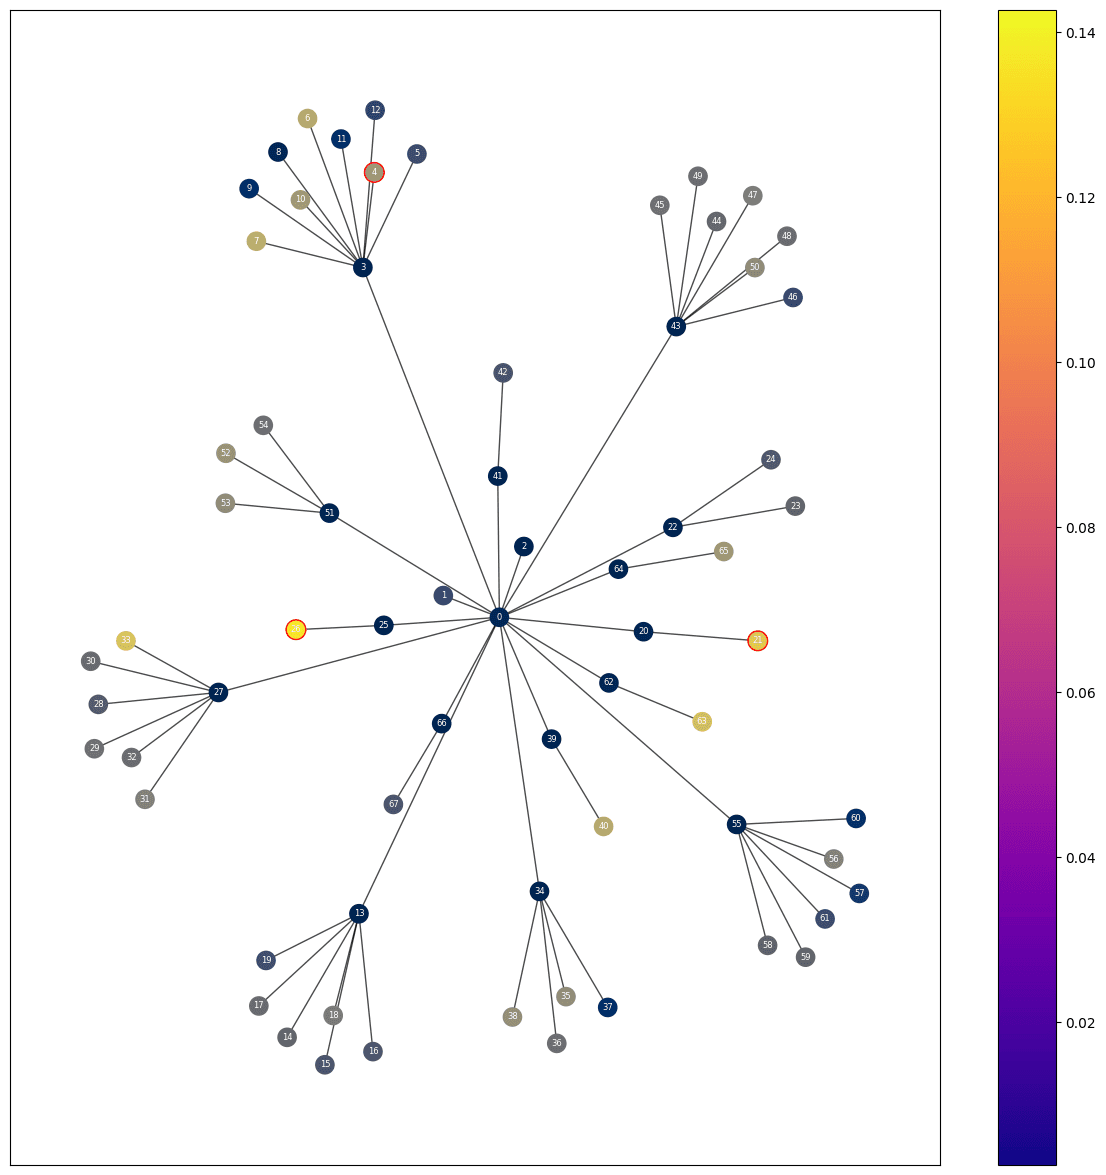
The scores each node gets using our method. The red circles represent the ground truth, the color represents the relative score, the brighter the higher the score.
“Source? Trust me bro”
In reality, it’s not the first time we benchmark our model.